Maxwell Construction
van der Waals Equation of State and Maxwell Construction
The van der Waals equation of state successfully represents the qualitative behaviors of real gases. This also shows the liquid-gas phase transition. Although van der Waals equation can be derived (in low density limit) using virial expansion. But heuristically it can be obtained by considering two corrections, volume correction and pressure correction, to the ideal gas equation. In ideal situation molecules are point particles and there is no interaction between the particles. Volume correction is due to the fact that particles have finite size. With volume correction the ideal gas equation is modified as,
where b is some constant and other symbols have their usual meaning. Pressure correction arises because a molecule near the wall of the container experiences a net backward attractive force resulting in the reduction of the effective pressure which colliding molecules exert on container walls, while the molecules inside the container experience force from all directions which tend to cancel each other. The reduction in pressure should depend upon the number of interacting pair of molecules (or number density). Hence with pressure correction the equation of state becomes
where a is some constant. This equation can be written in terms of the specific volume $v$ as,
For a given T, the dependence of P on $v$ can be plotted. We get three characteristically diffrerent plots as T is varied.
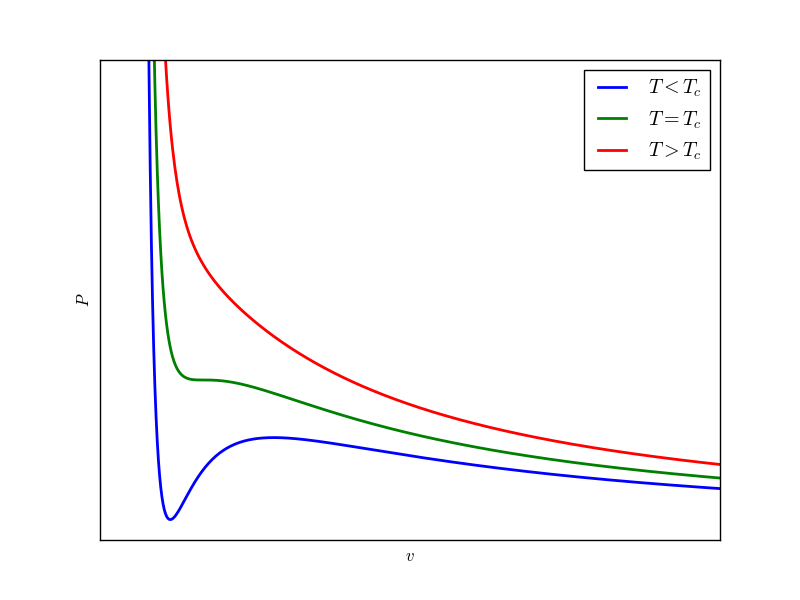
The second term in van der Walls equation can be neglected at sufficiently high temperature and the behaviour is monotonically decreasing, similar to the ideal gas. At low enough temperature the behaviour is completely diffrerent, there are hills and valleys. At some intermediate temperatutre $T_c$ (called critical temperature) the hill and valley flatten in order to match the behaviour at high temperatures.
Now we analyse the isotherm for $T < T_c$ in detail. For a given $P$ there exist three values of $v$. This is also explicit if the van der Walls equation is looked as a cubic equation in $v$ for a given $P$. There is something wierd here. For some intermediate portion of the plot the slope $dP/dv > 0$, which is not acceptable. This implies, if a container filled with a gas is squeezed, the pressure of the gas decreases. Such a gas is in unstable state. If somehow a gas is brought in such a state then any slight perturbation will rapidly change its state. The lower density ($\rho={1}/{v}$) region after the unstable region represents gaseous state while higher density region before the unstable region where the slope $dP/dv$ is relatively larger, belongs to liquid state. Here we want to discuss, what replaces the unstable region between the liquid and gas state.
From Gibbs-Duhem relation,
$$Nd\mu=-SdT+VdP$$
$\implies$ $$d\mu=-sdT+vdP$$
where $s=S/N$ and $v=V/N$.
For constant temperature,
$$\big(\frac{d\mu}{dP}\big)_T=v ....................(1)$$
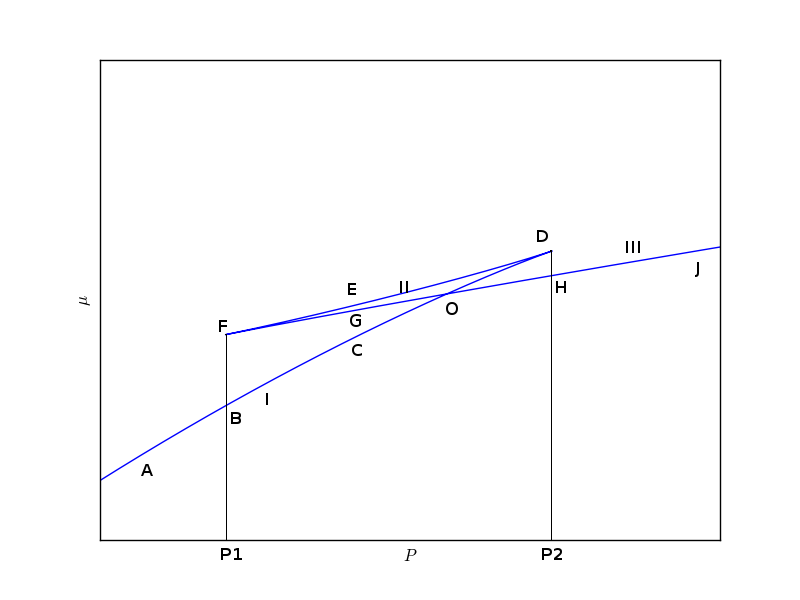
Now using above equation we try to plot the dependence of $\mu$ on P for a given isotherm. In this regard, we note following observations:
- For small pressure ($P
- For intermediate pressure values the curve is triple valued
- For high pressure ($P>P2$) the curve is again single valued
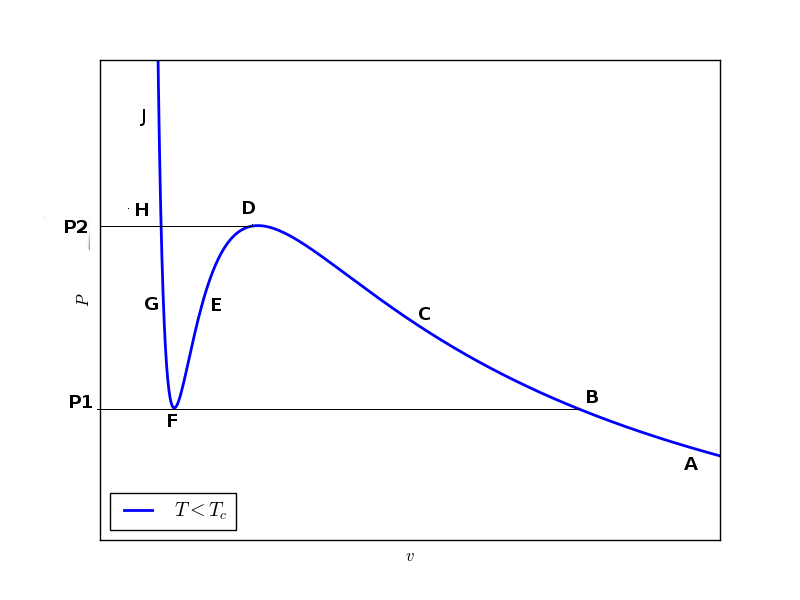
We start with a point (like A) on the isotherm corresponding to a lower pressure value ($P
For pressure $P1
Curve I extends up to $P2$ while curve II lies between $P1$ and $P2$. Curve III starts at $P1$ but it should continue for any higher value of pressure.
Only following $\mu-P$ curve is possible which satisfies the observations listed above. This curve has a bounded region which gets smaller and smaller as we increase the temperature because $P1$ and $P2$ gets closer with increasing temperature. At the critical temperature the bounded region vanishes. Now using this $\mu-P$ curve we try to sort out the problem that the van der Walls equation has, as discussed above.
Suppose the pressure of the system, starting with state $A$, is increased isothermally and quasi-statically then up to the pressure $P2$ i.e., state $B$ there is no any problem. But as the pressure is increased above $P1$ there are three states ($C, E$ and $G$) which are available. Out of the available three states, one state ($E$) is unstable while which of the other two states is selected by the system depends on where the system is local minimum of Gibbs potential. Since we are moving away from state $B$ hence $C$ is the true physical state for this given value of pressure and temperature.
If pressure is increased slightly, a state $O1$ is reached where free energy has same value as at $O3$ i.e., $\mu_{O3}=\mu_{O1}$ (these two states have been represented by $O$ in $\mu-P$ curve where curve I and III intersect each other). If pressure is further increased above $P3$ then states lying on branch III are preferred bypassing all intermediate states because they don't represent physically significant state.
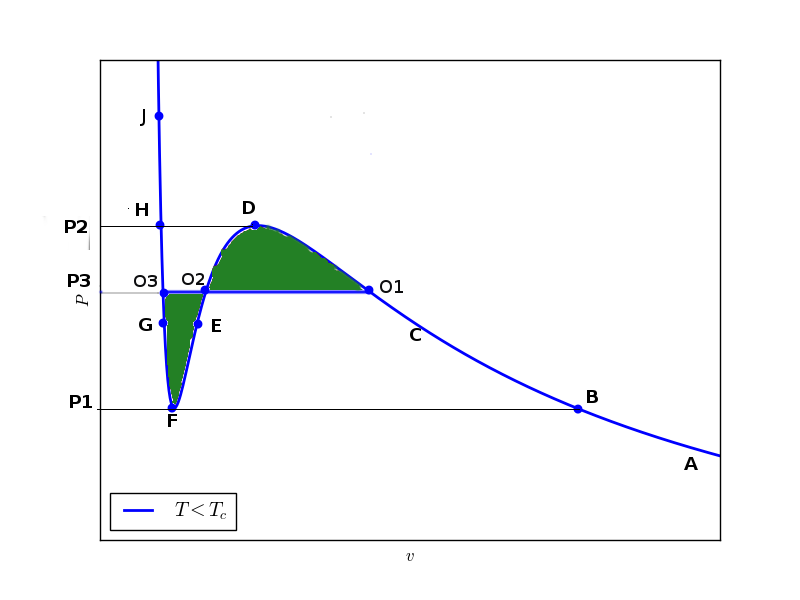 Hence the physical isotherm which reresents a true system is $A-B-C-O1-O2-O3-H-J$
Now we see from equation (1) that,
$$\mu_{O3}-\mu_{O1}=\int_{O1}^{O3}vdP$$ where integral is over the hypothetical path $O1-D-O2-E-F-G-O3$. But $\mu_{O3}=\mu_{O1}$. So,
$$\int_{O1}^{O2}vdP=0$$ This integral can be broken into following integrals:
$$\int_{O1}^{D}vdP+\int_{D}^{O2}vdP+\int_{O2}^{F}vdP+\int_{F}^{O3}vdP=0$$
This can be rearranged to following integrals:
$$\int_{O1}^{D}vdP-\int_{O2}^{D}vdP=\int_{F}^{O2}vdP-\int_{F}^{O3}vdP$$
This tells nothing but the upper shaded green area is equal to the lower shaded green area. This construction is called Maxwell equal area construction. Only after the truncation by this equal area construction the isotherm represents a true physical isotherm.
Lever Rule
We have seen that at constant temperature, upto some pressure $P3$ the specific volume of the system decreases with increase in pressure and then specific volume changes at constant pressure $P3$ for a while. If the pressure of the system is reduced isothermally from some high pressure $P>P2$ then again specific volume changes with a change in pressure intially and then at constant pressure $P3$. The question is what is the state of the system, gas or liquid, when specific volume is changing at constant pressure? Actully system is a mixture of liquid and gas. The amount of liquid and gas is such that the average density correspond to current state of the system on the horizontal line. If system is moving from left to right then amount of gaseous phase keeps increasing untill state $O1$ is reached where whole system is in liquid phase. And if system is taken from right to left then liquid phase keeps growing but at state $O3$ the complete system is in liquid phase. In this way van der Walls equation is capable of showing liquid-gas phase transition.
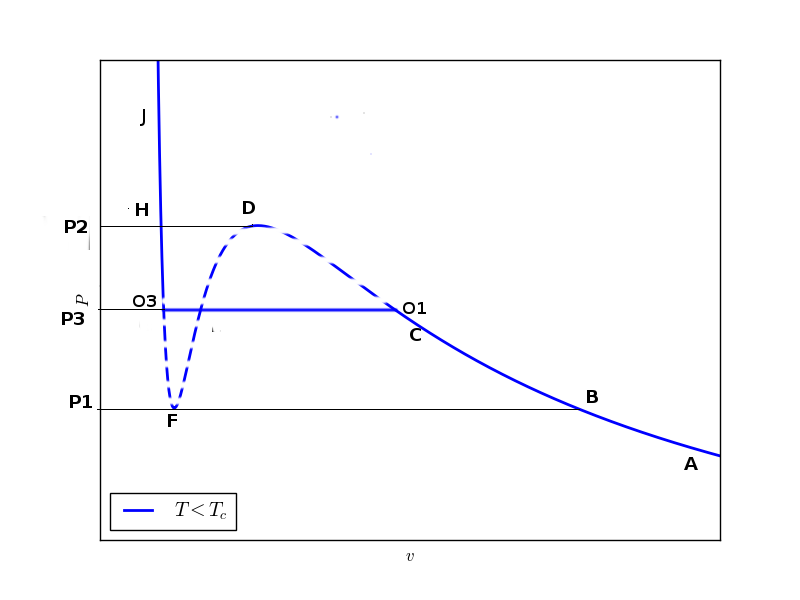 Lever rule allows us to determine the determine the fraction of system in liquid and gas phase during the phase transition. If $v_l$ and $v_g$ are the values of specific volumes at $O3$ and $O1$ respectively then at any state $Z$ on flat curve where specific volume is $v=V/N$, we can write
$$V=Nv=N[x_lv_l+x_gv_g]=N[x_lv_l+(1-x_l)v_g]$$ where $x_l$ and $x_g$ are the mole fractions of liquid and gas phase in the mixture. This equation can be simplified to
$$x_l=\frac{v-v_g}{v_l-v_g} ;x_g=\frac{v-v_l}{v_g-v_l} $$
These equations are nothing but the ratios of the distances of the extreme points $O1$ and $O3$ from the state $Z$ on flat curve.

Meta-stable States
Initially we said that there are some states where $dP/dv>0$ are unstable and we removed them using Maxwell construction. But it seems that we have even removed some of the states where $dP/dv<0$. These states have been shown within the region bounded by two parabola like curves in the figure below. The outer curve is called co-existence curve while the inner one passing through the stationary points of isotherms is called spinodal curve.
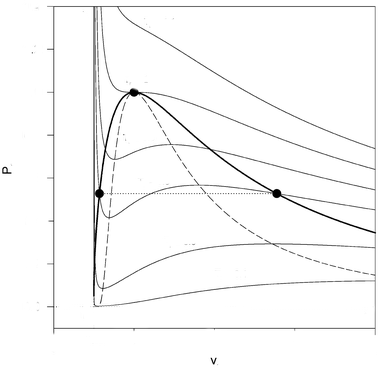 The states between the co-existence curve and spinodal curve are meta-stable because system can be pushed to these states (superheated liquid state or supercooled vapour state) if the pressure of the system is changed slowly but any slight disturbance will push it back to gas or liquid state.
